Gallery
A look at the kinds of dashboards Control Seat can build. Each example below was generated by AI from a single text prompt.
Note: these are demo dashboards. The visuals are AI-generated previews and all metrics shown are placeholder data, not live or customer information.
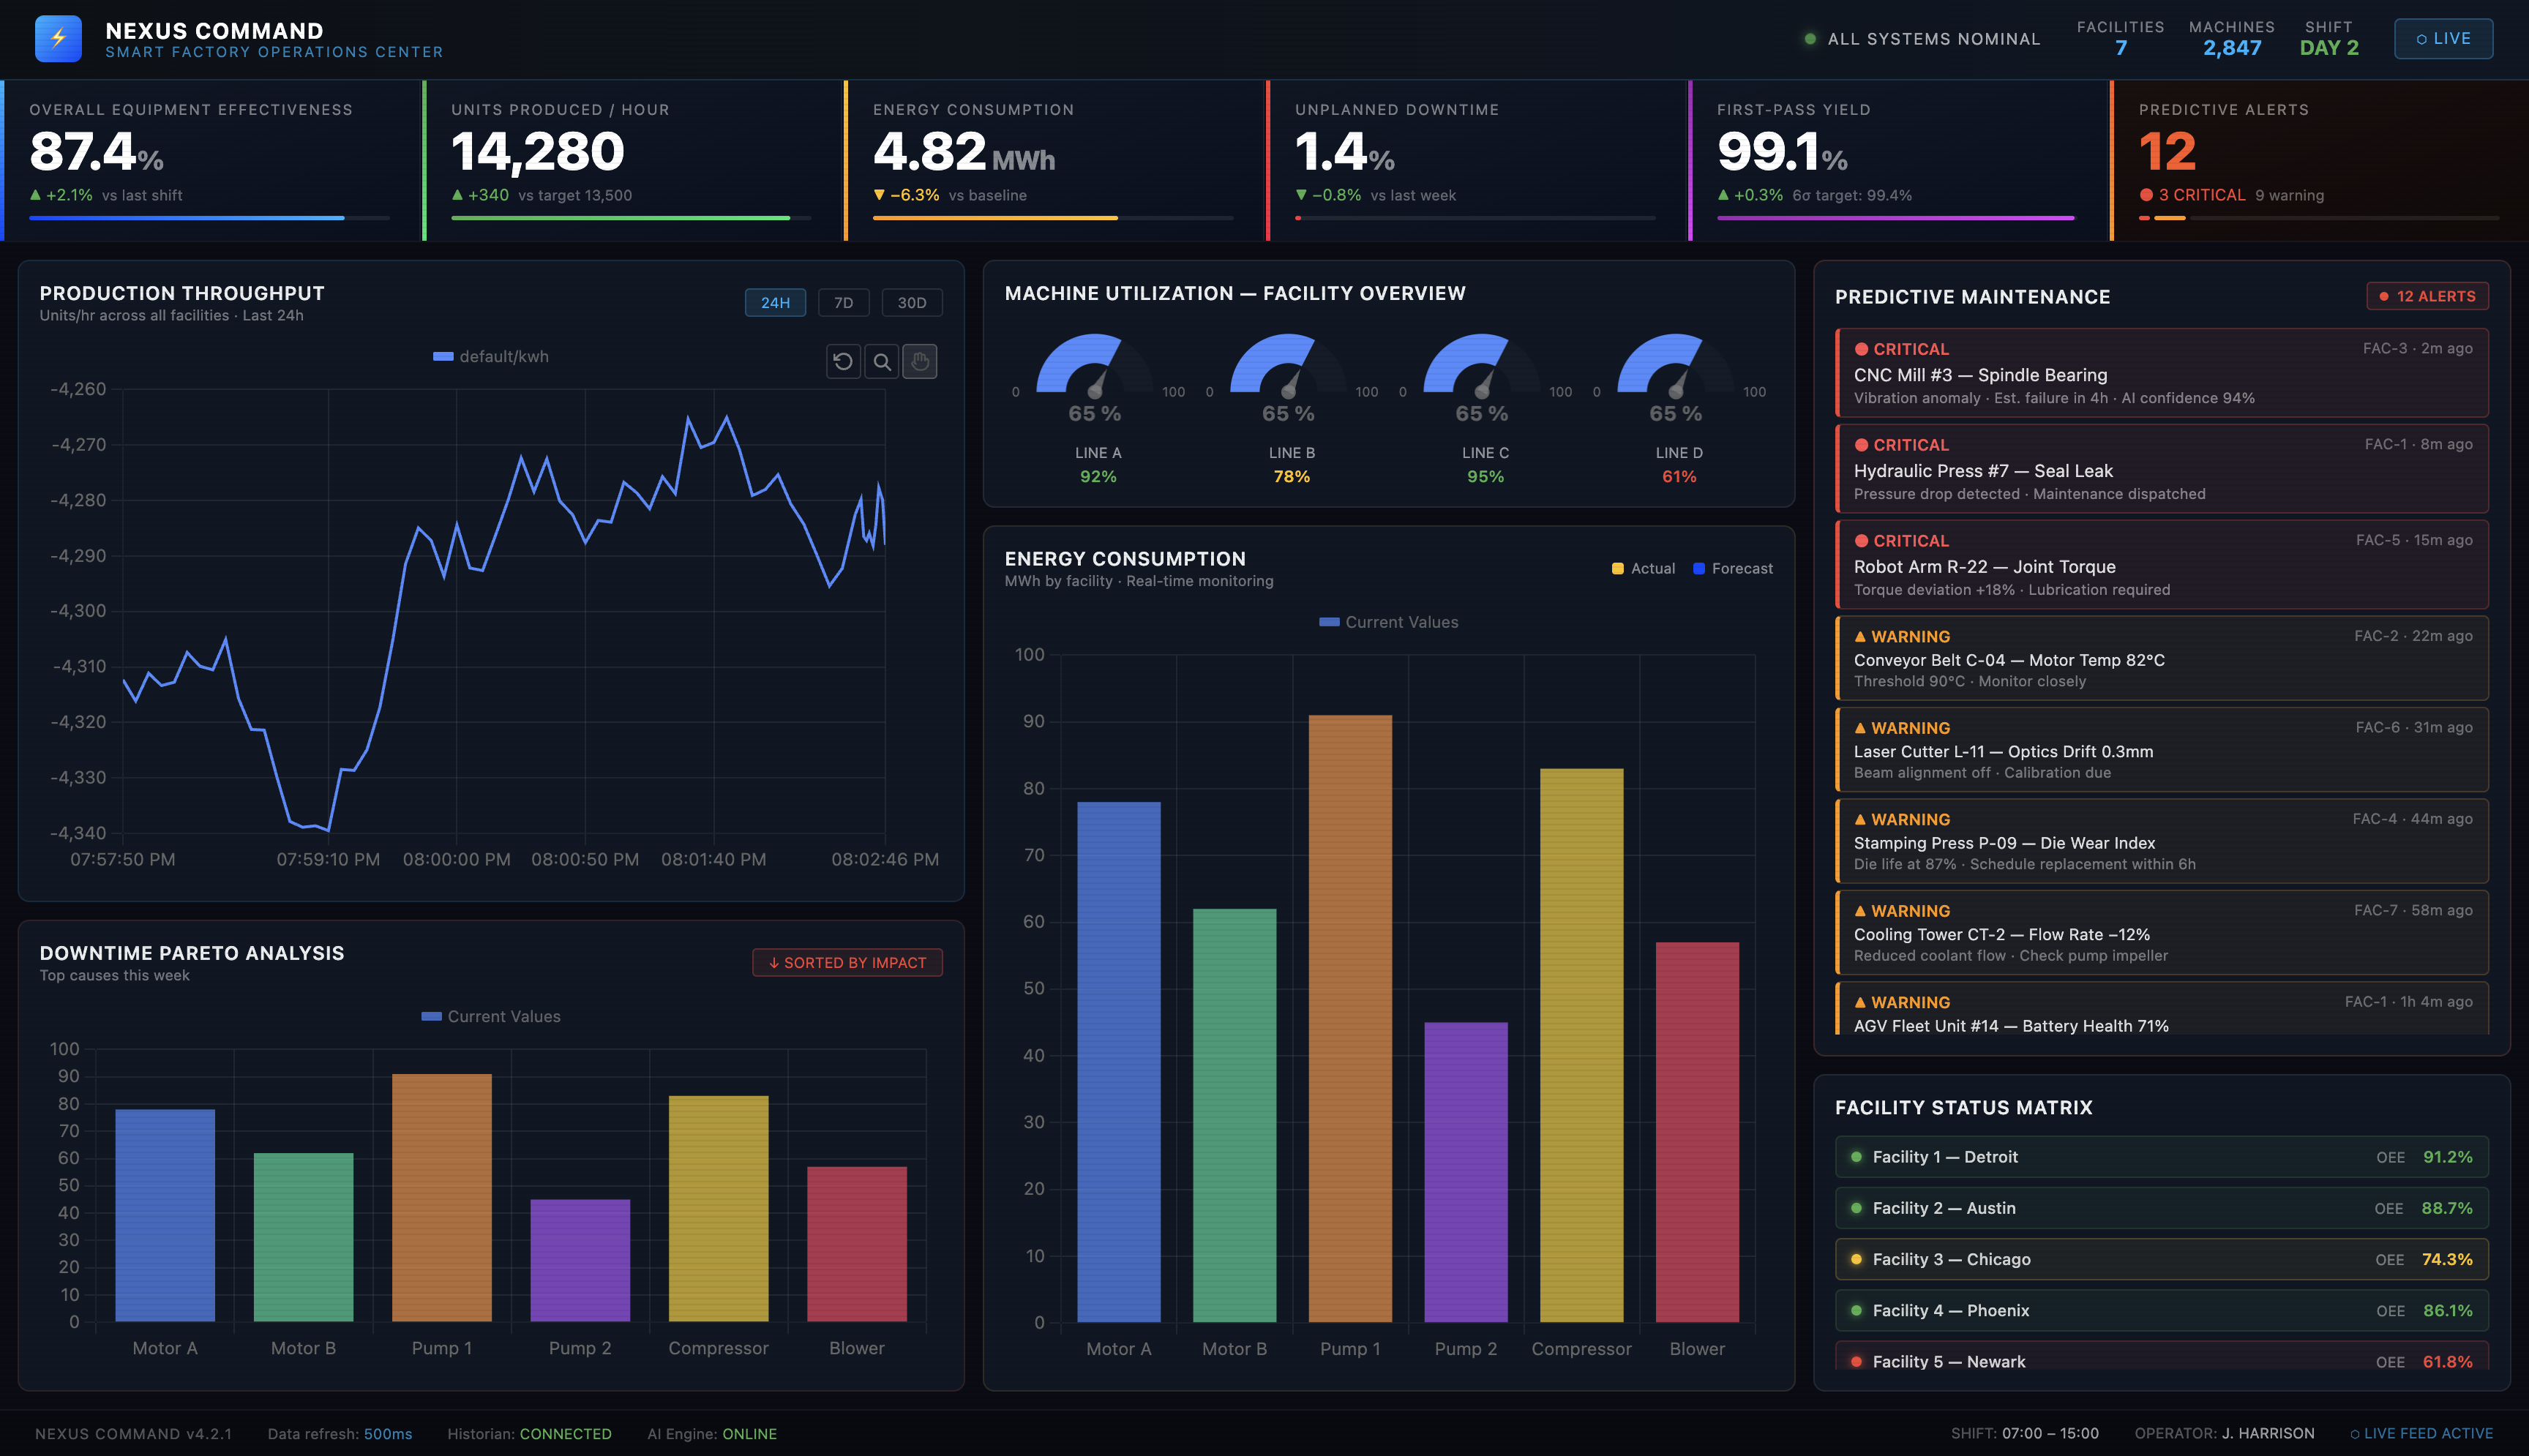
Smart Factory Command Center
Design a next-generation smart factory command center dashboard. Show live production metrics, predictive maintenance alerts, energy consumption, downtime analytics, and machine utilization across multiple facilities. Include large wallboard-style KPI sections and interactive drilldowns. Make it look like software used inside a billion-dollar factory.
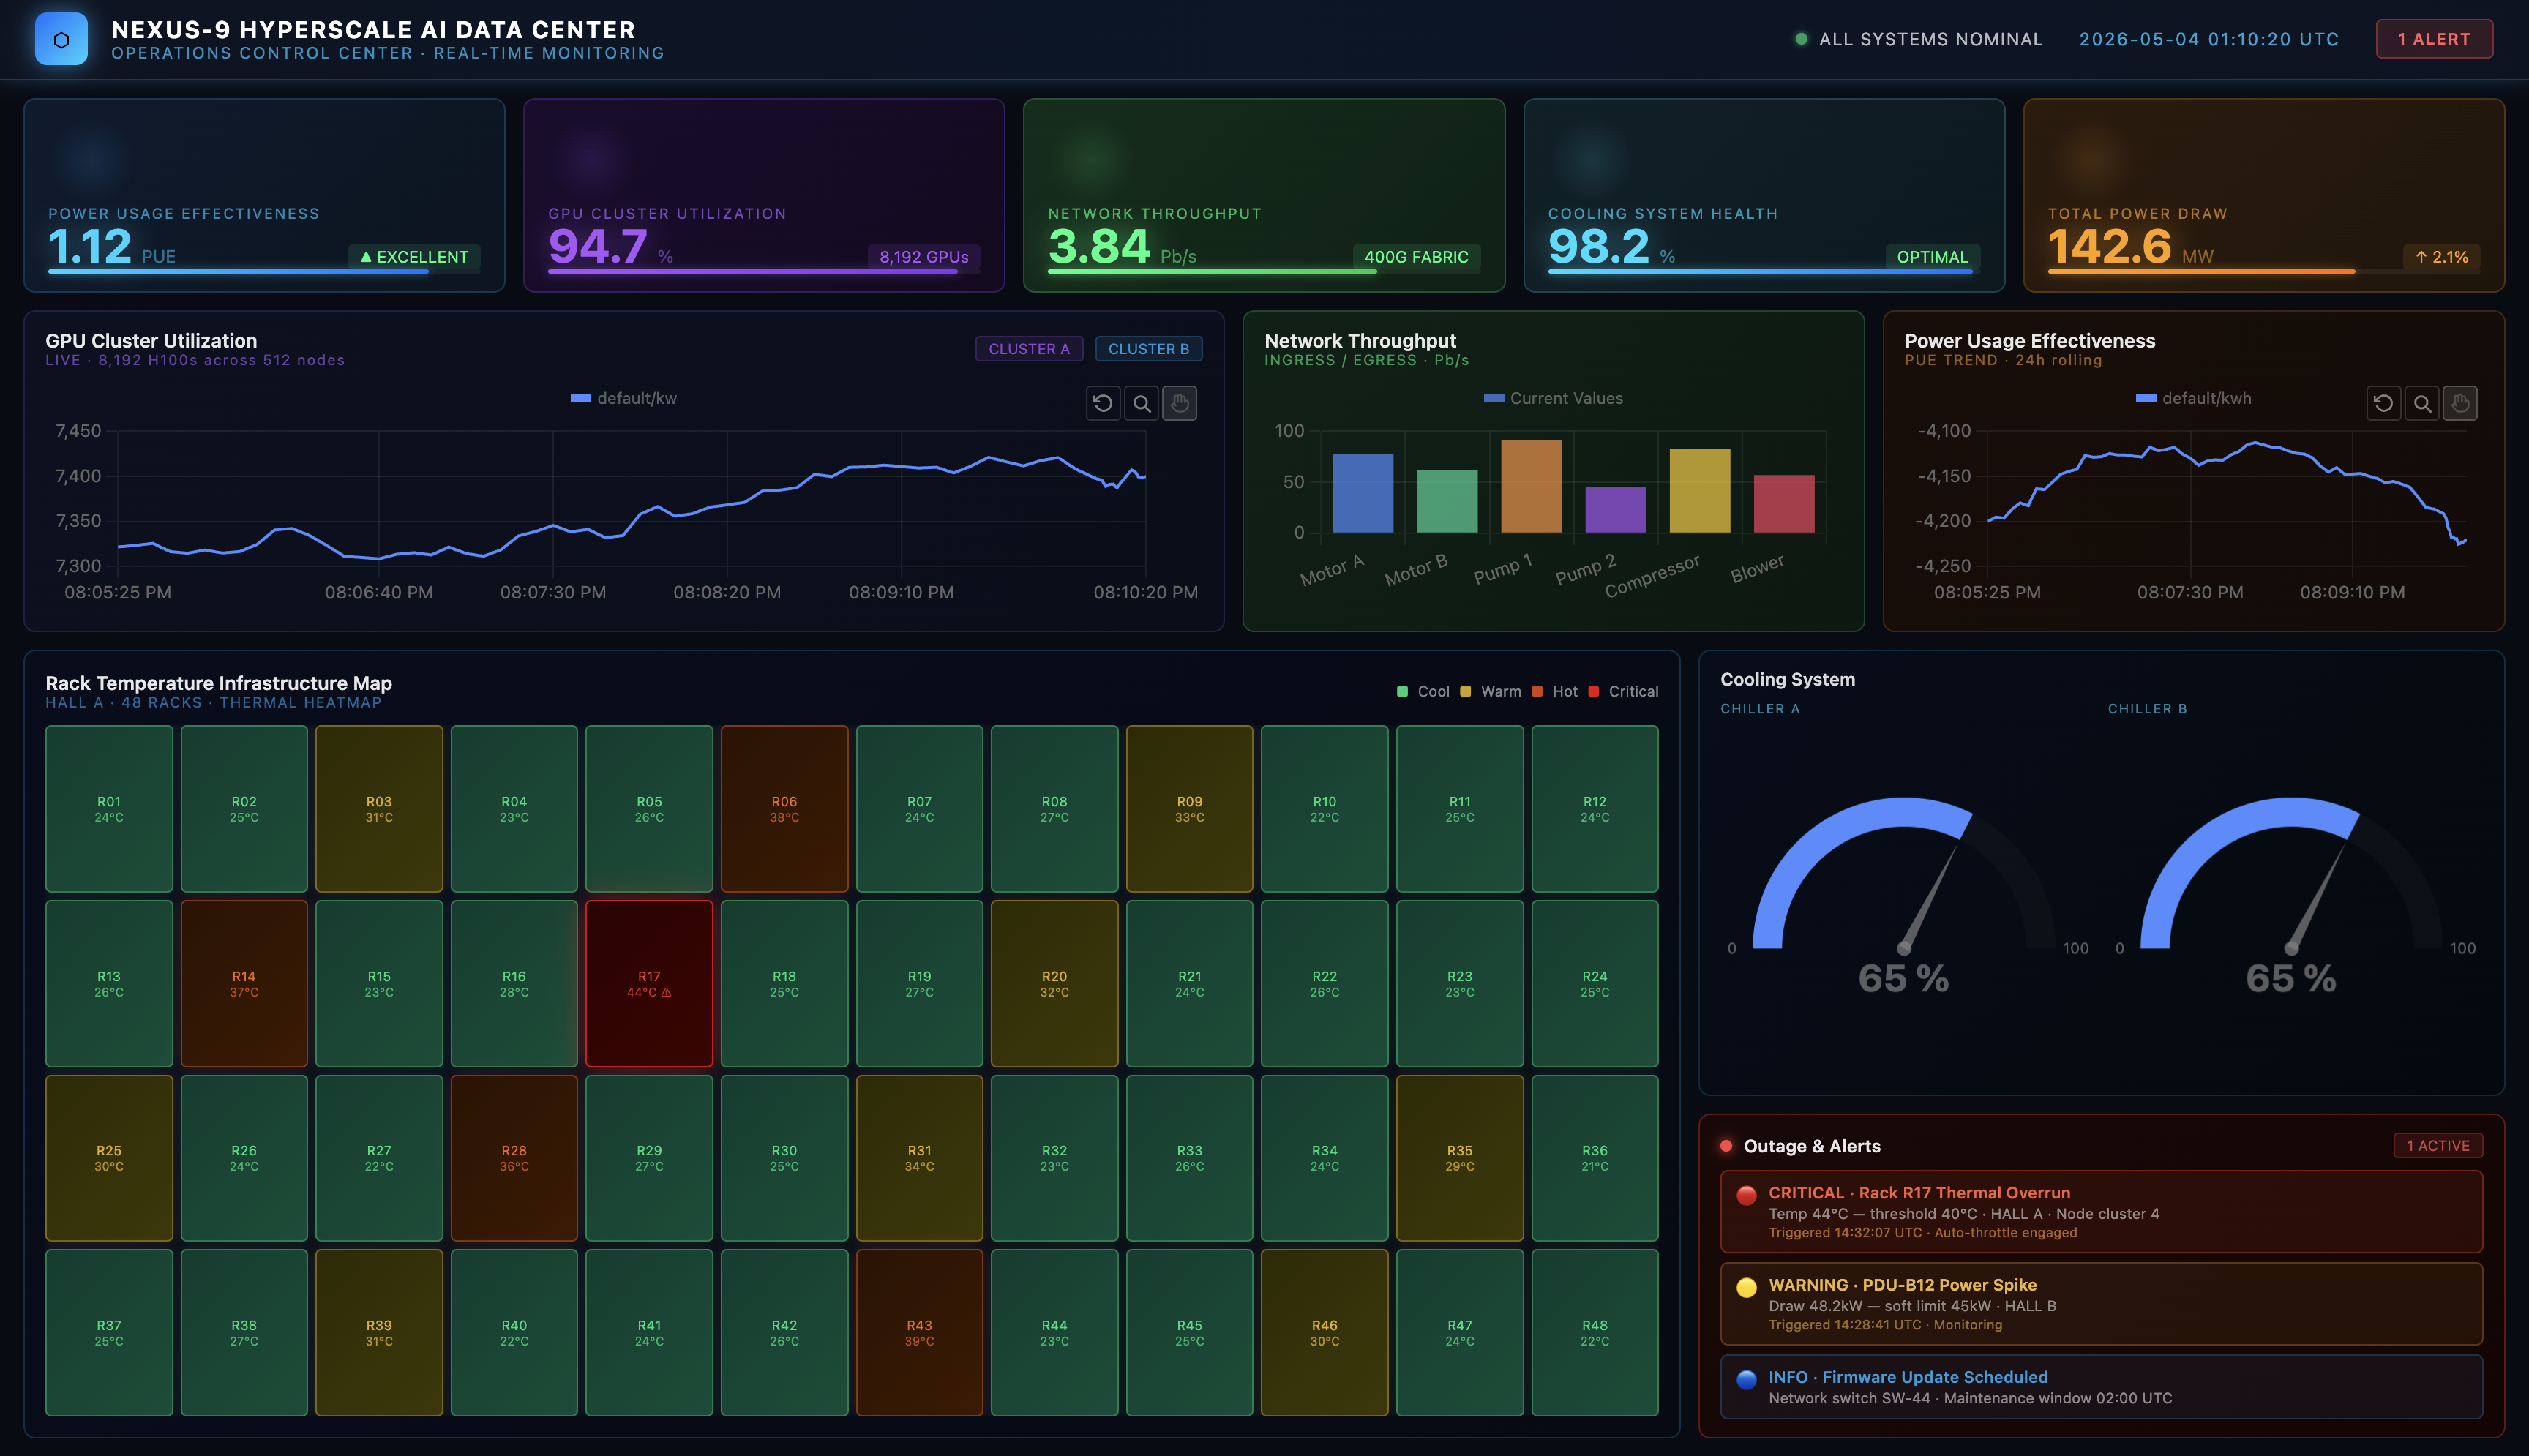
AI Hyperscale Data Center
Build an advanced real-time dashboard for monitoring an AI hyperscale data center. Include GPU cluster utilization, cooling system health, rack temperatures, power usage effectiveness (PUE), network throughput, and outage alerts. Make the interface cinematic and high-tech with glowing infrastructure maps and live trend visualizations.
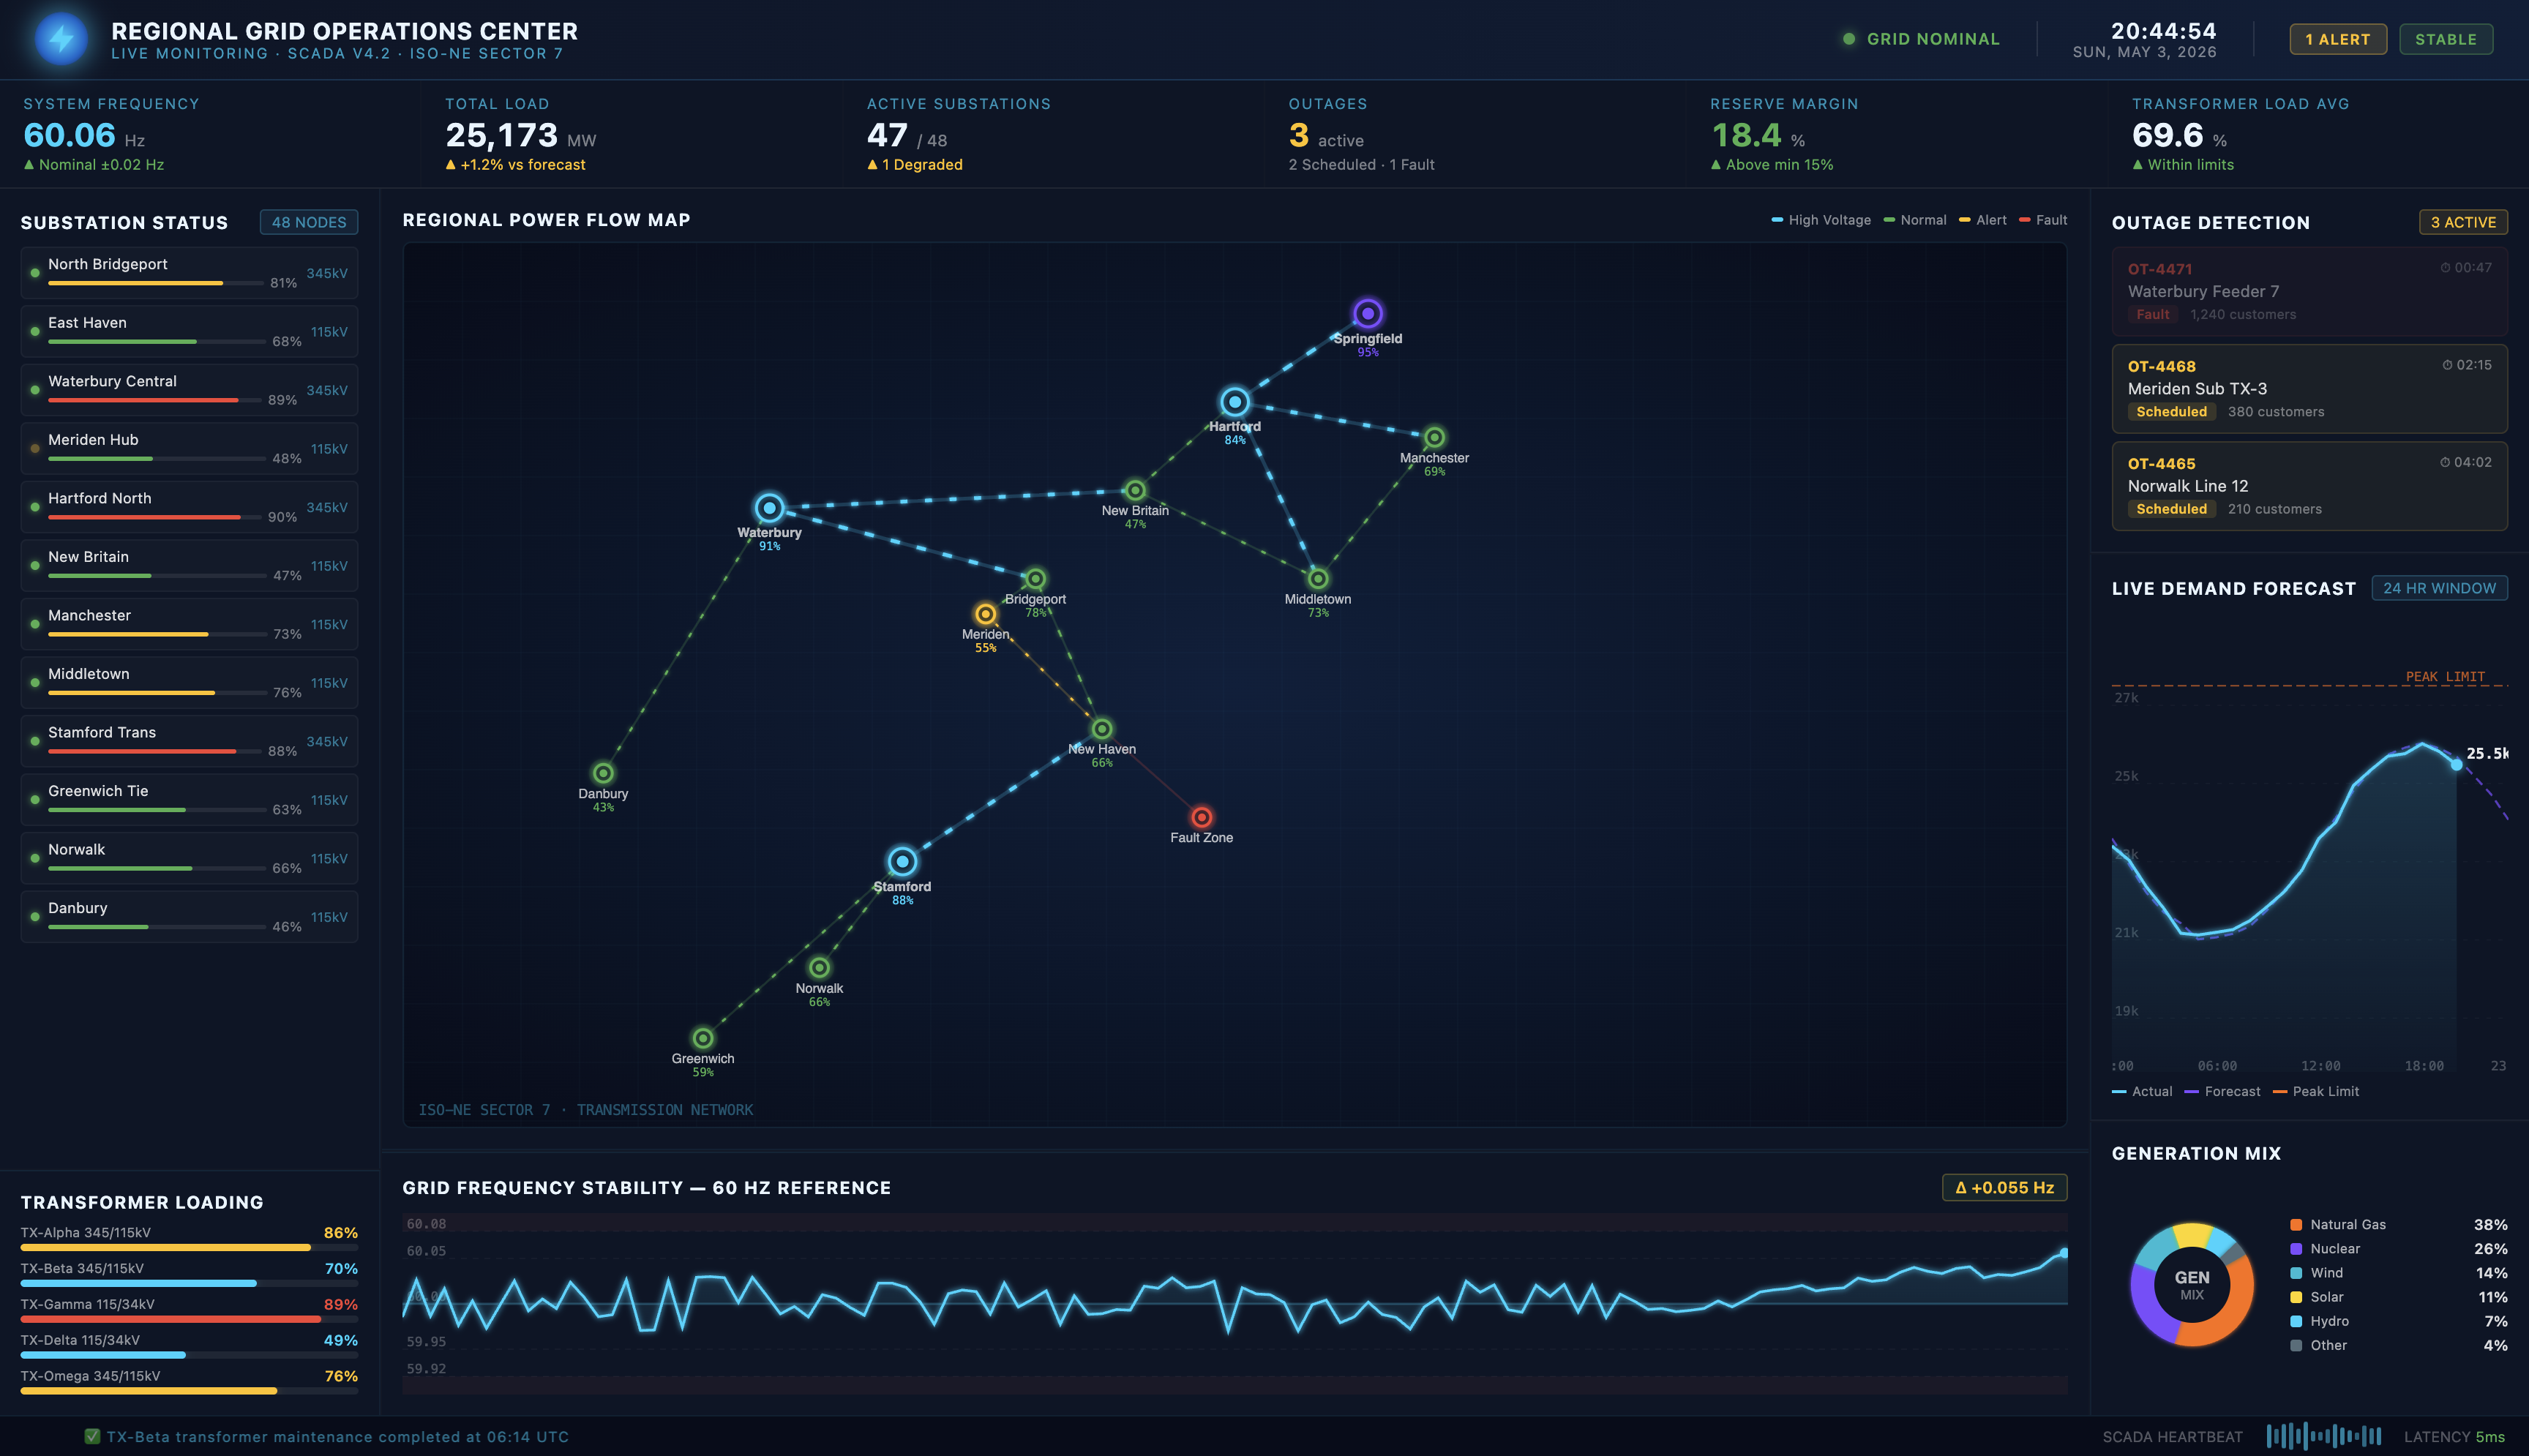
Grid Operations
Create a grid operations dashboard for monitoring regional electrical infrastructure. Include substations, transformer loads, outage detection, grid frequency stability, power flow maps, and live demand forecasting. Use a dark modern utility-operations aesthetic with animated infrastructure visuals.
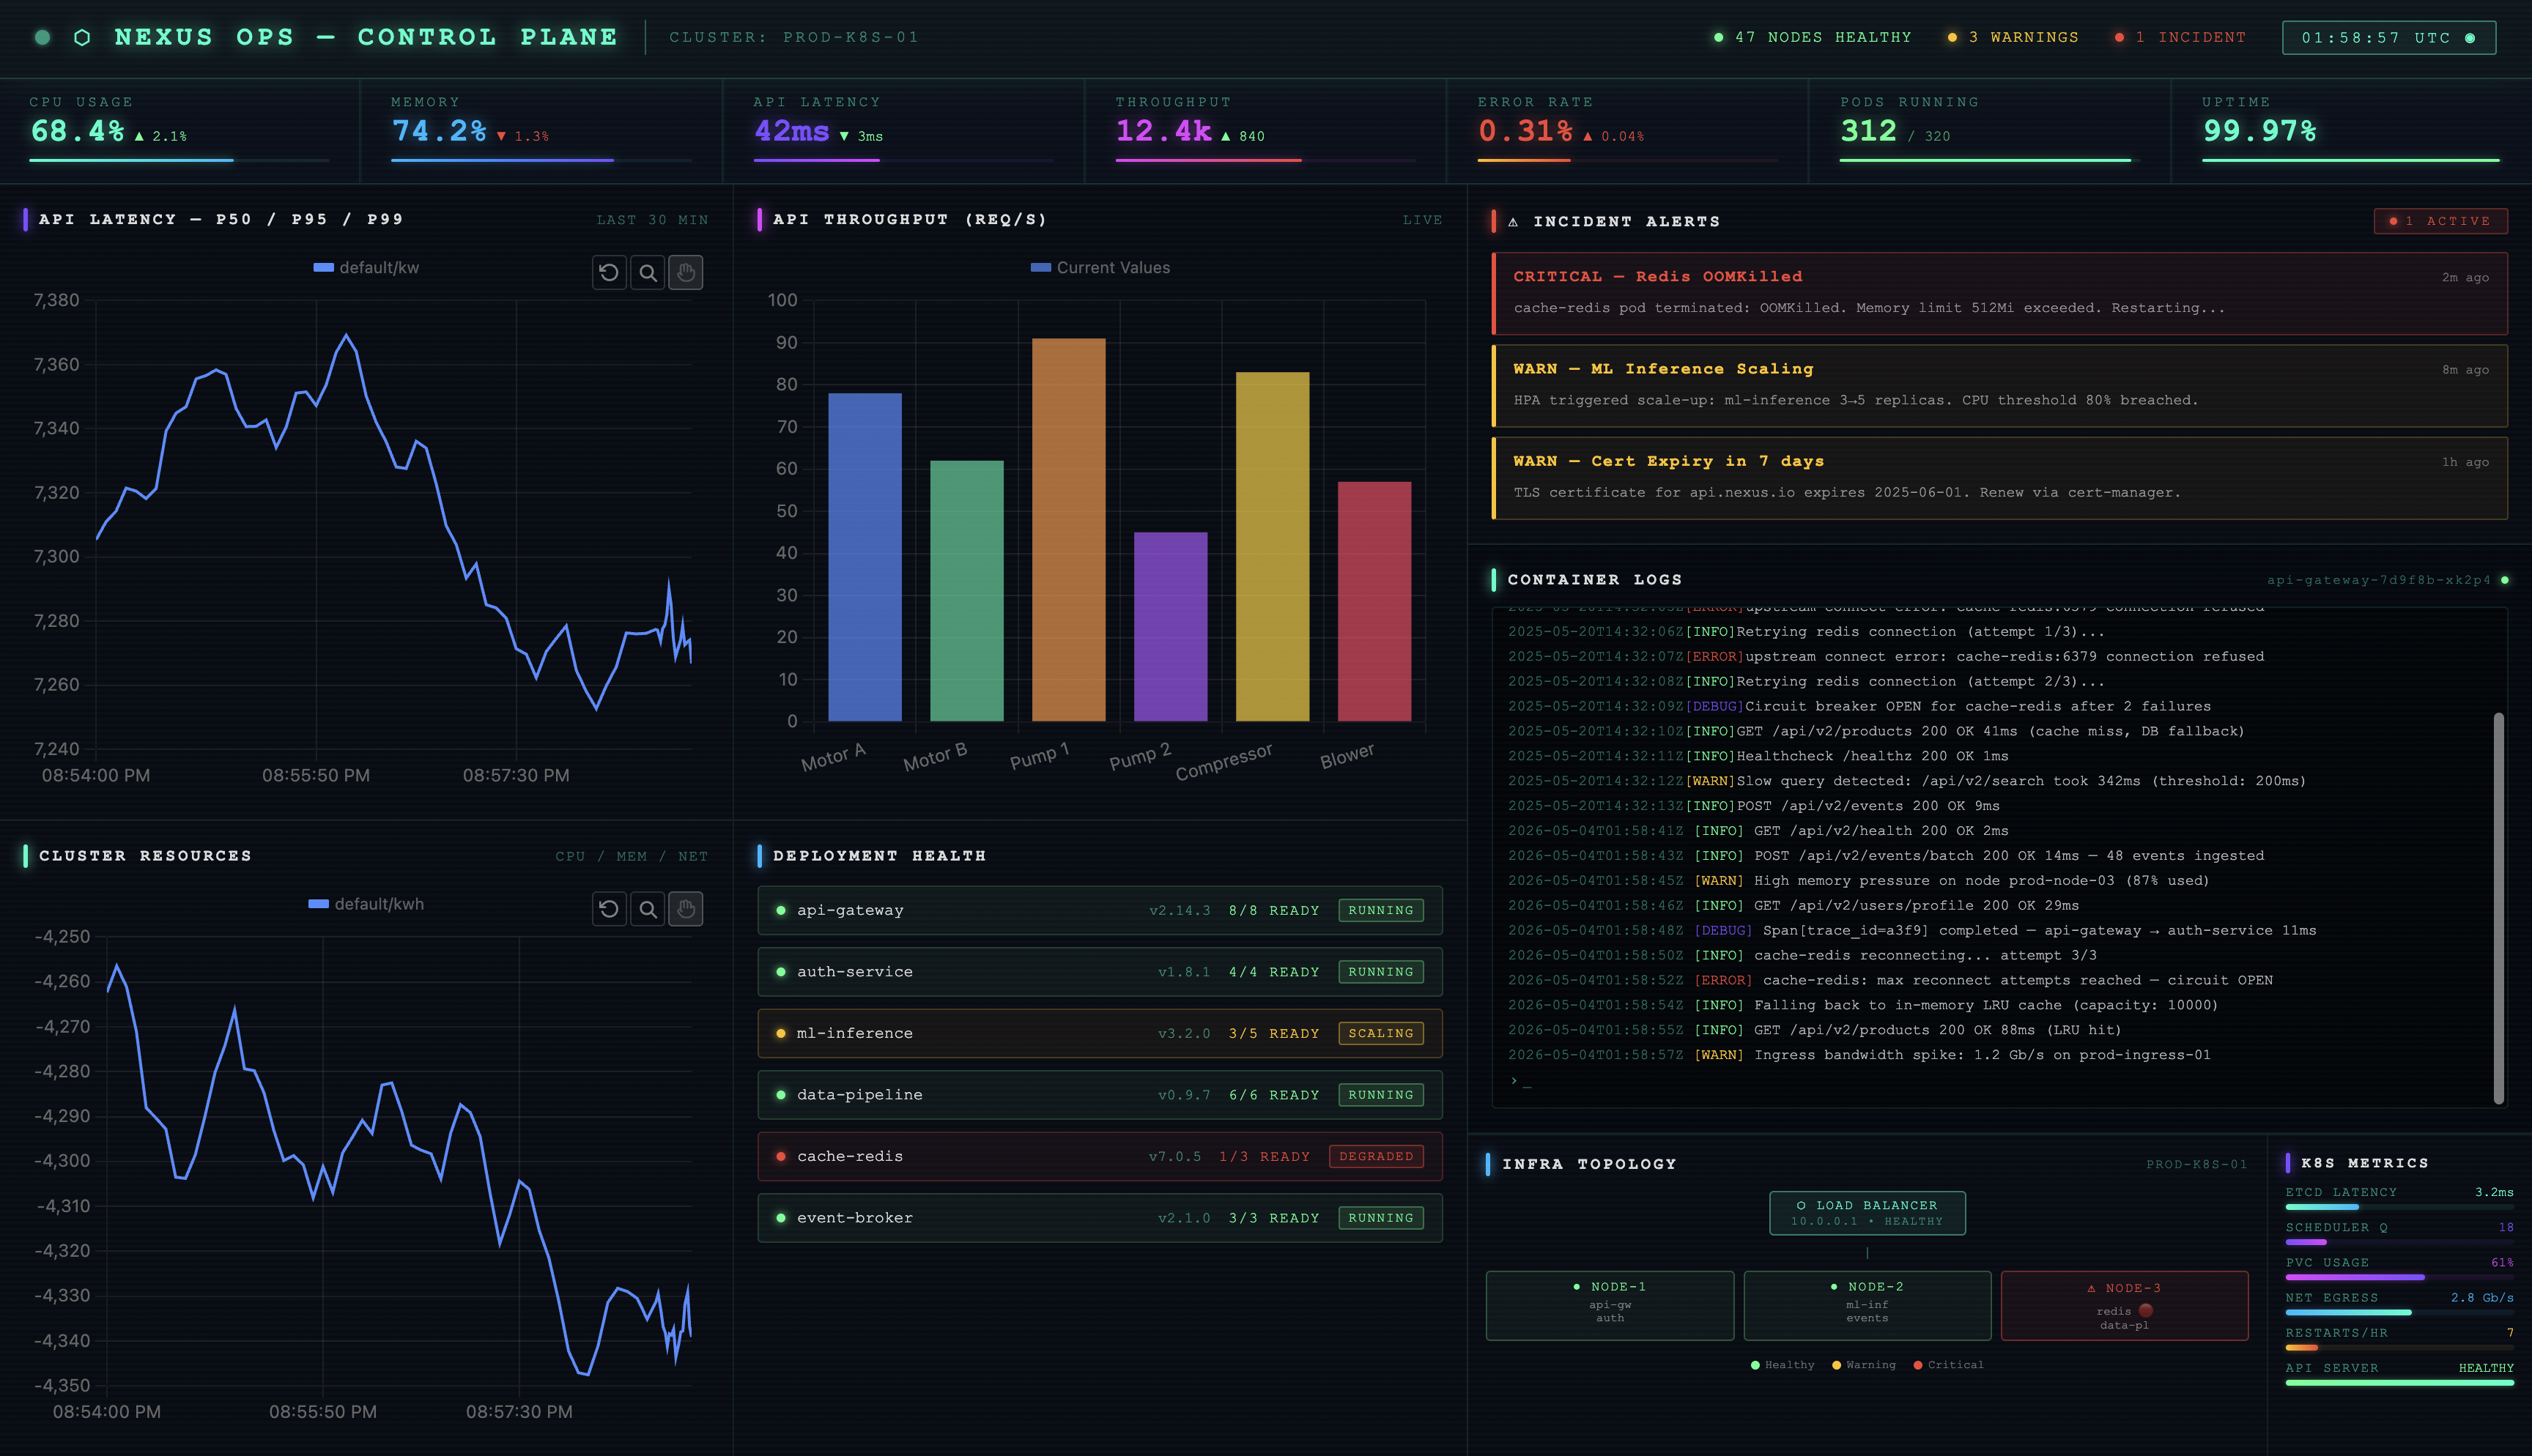
DevOps Monitoring
Build a highly polished DevOps monitoring dashboard with Kubernetes metrics, deployment health, container logs, latency charts, API throughput, incident alerts, and infrastructure maps. Make the design cinematic and futuristic with neon accents, responsive panels, animated charts, and terminal-inspired components.
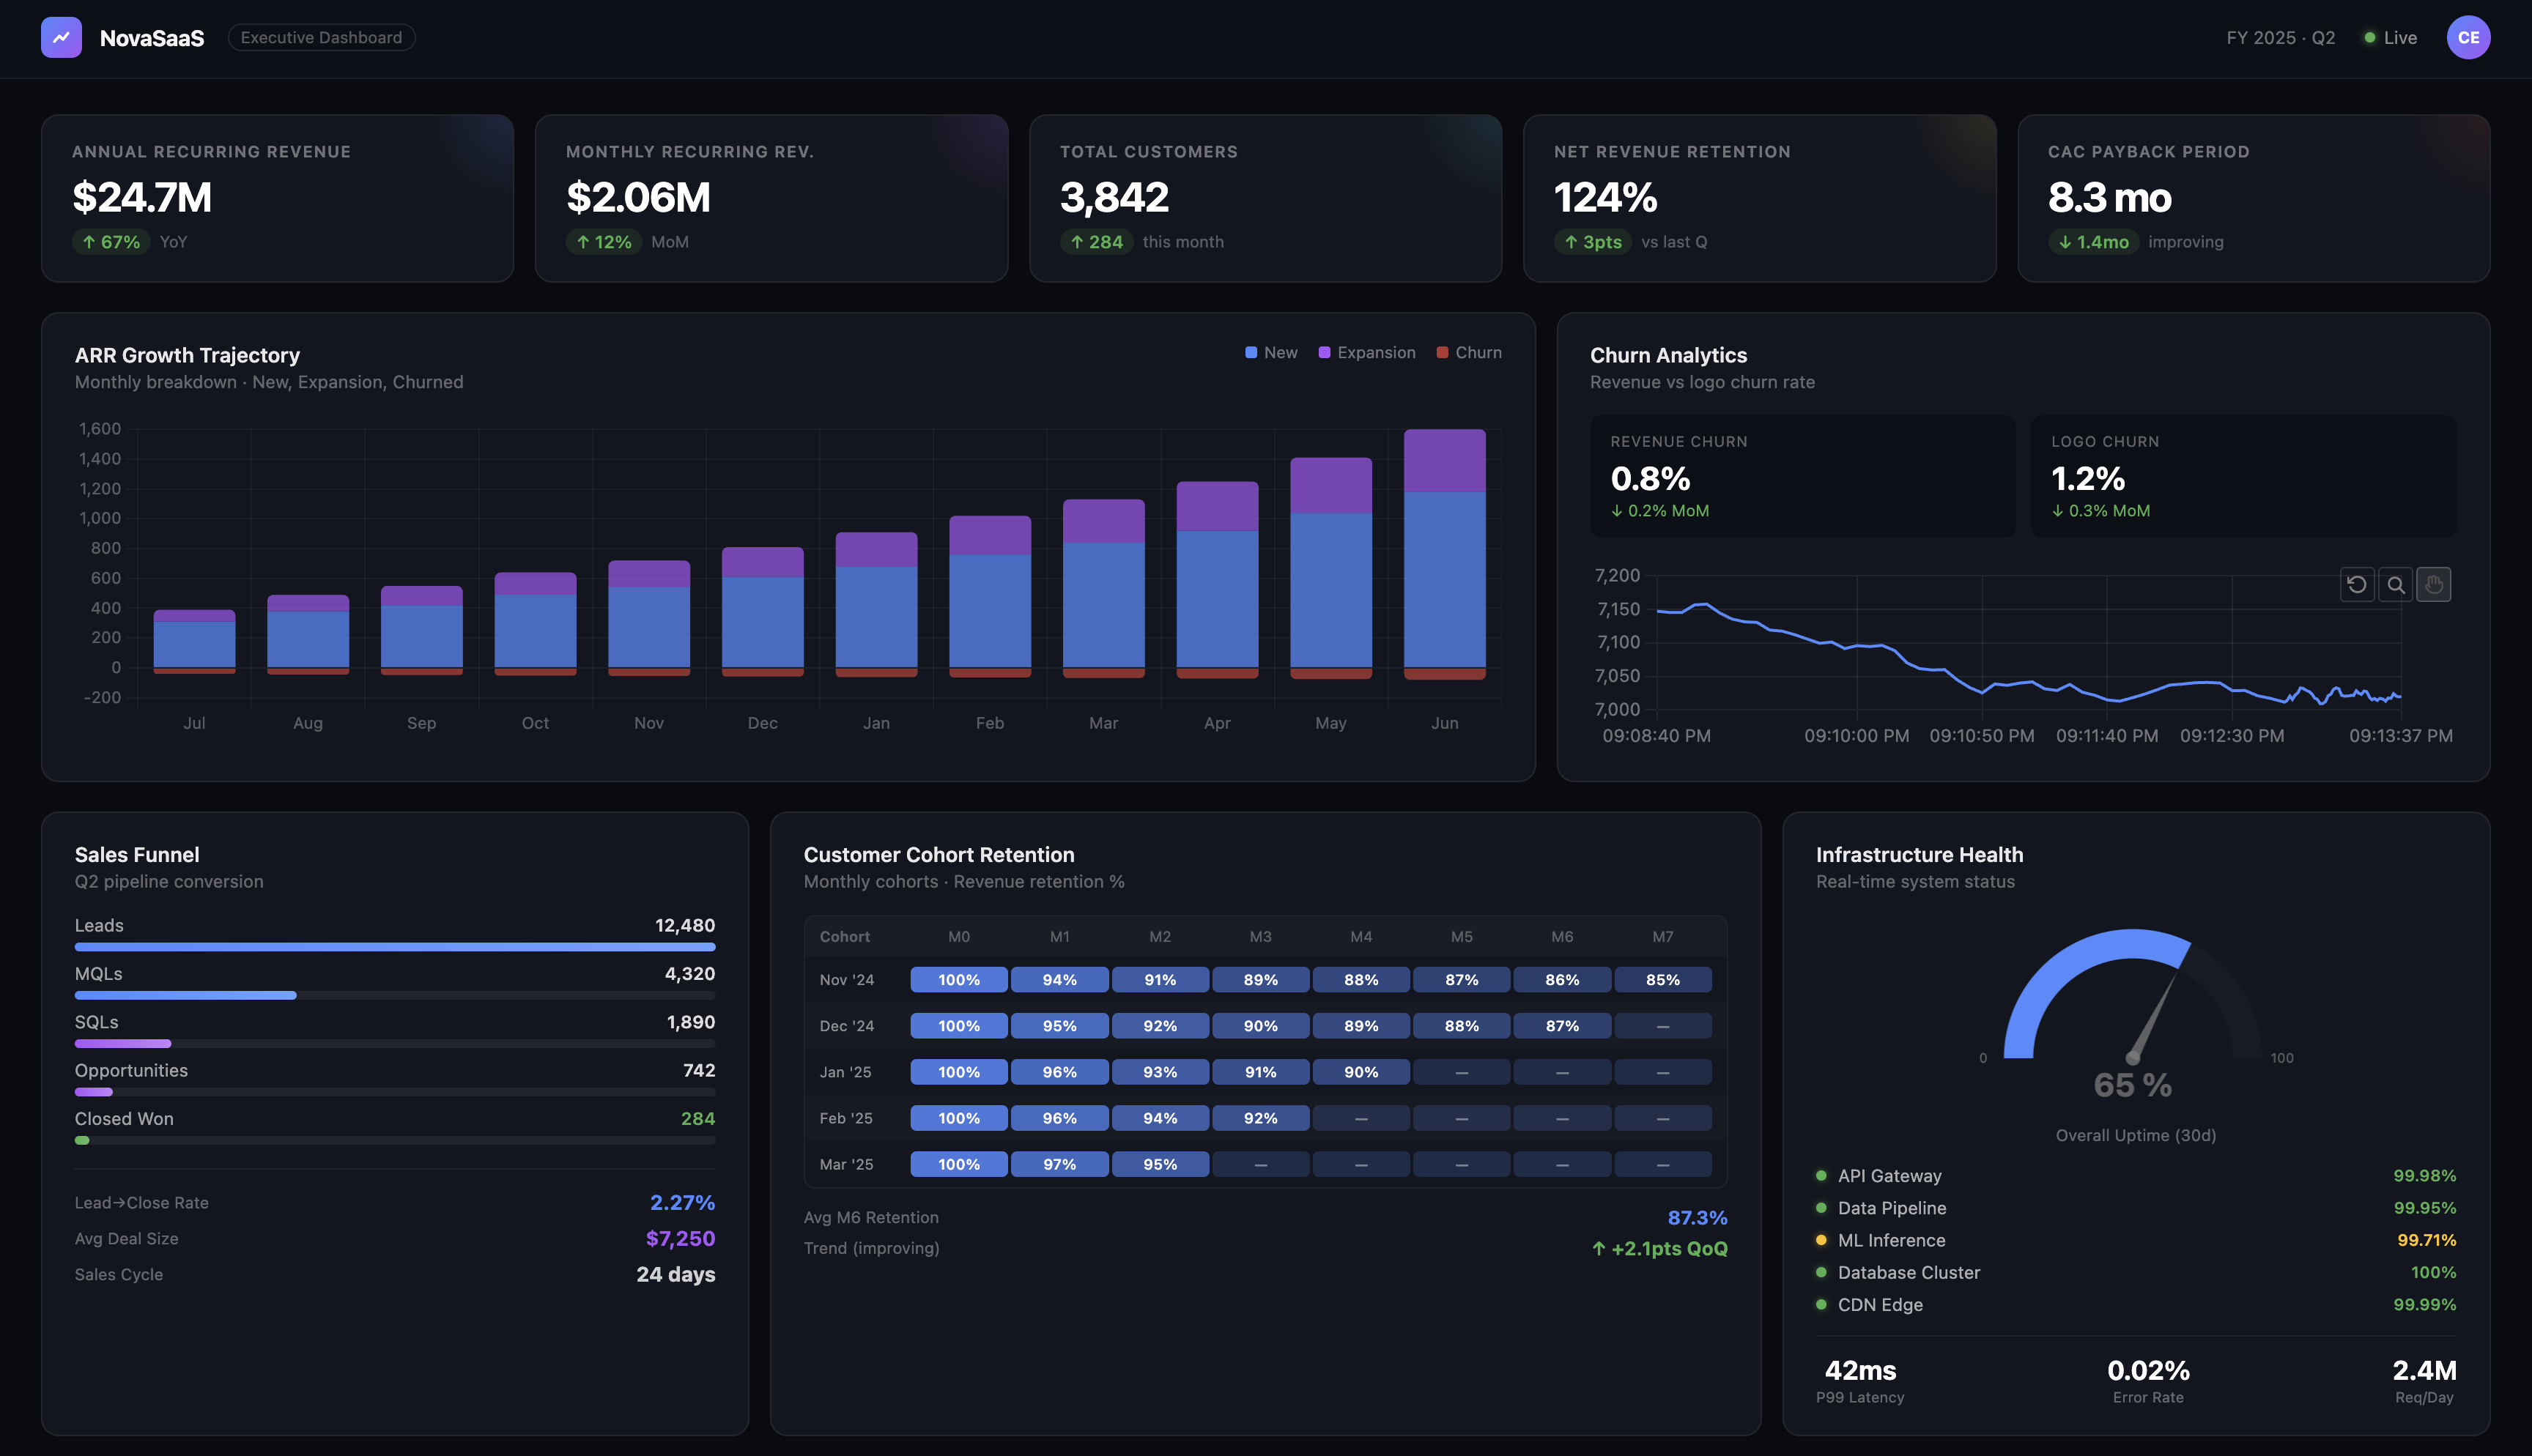
SaaS Executive Dashboard
Create a beautiful executive dashboard for a fast-growing SaaS company. Include ARR growth, churn analytics, sales funnel metrics, customer cohorts, infrastructure health, and AI-generated business insights. Make the design minimal, premium, and investor-demo quality.
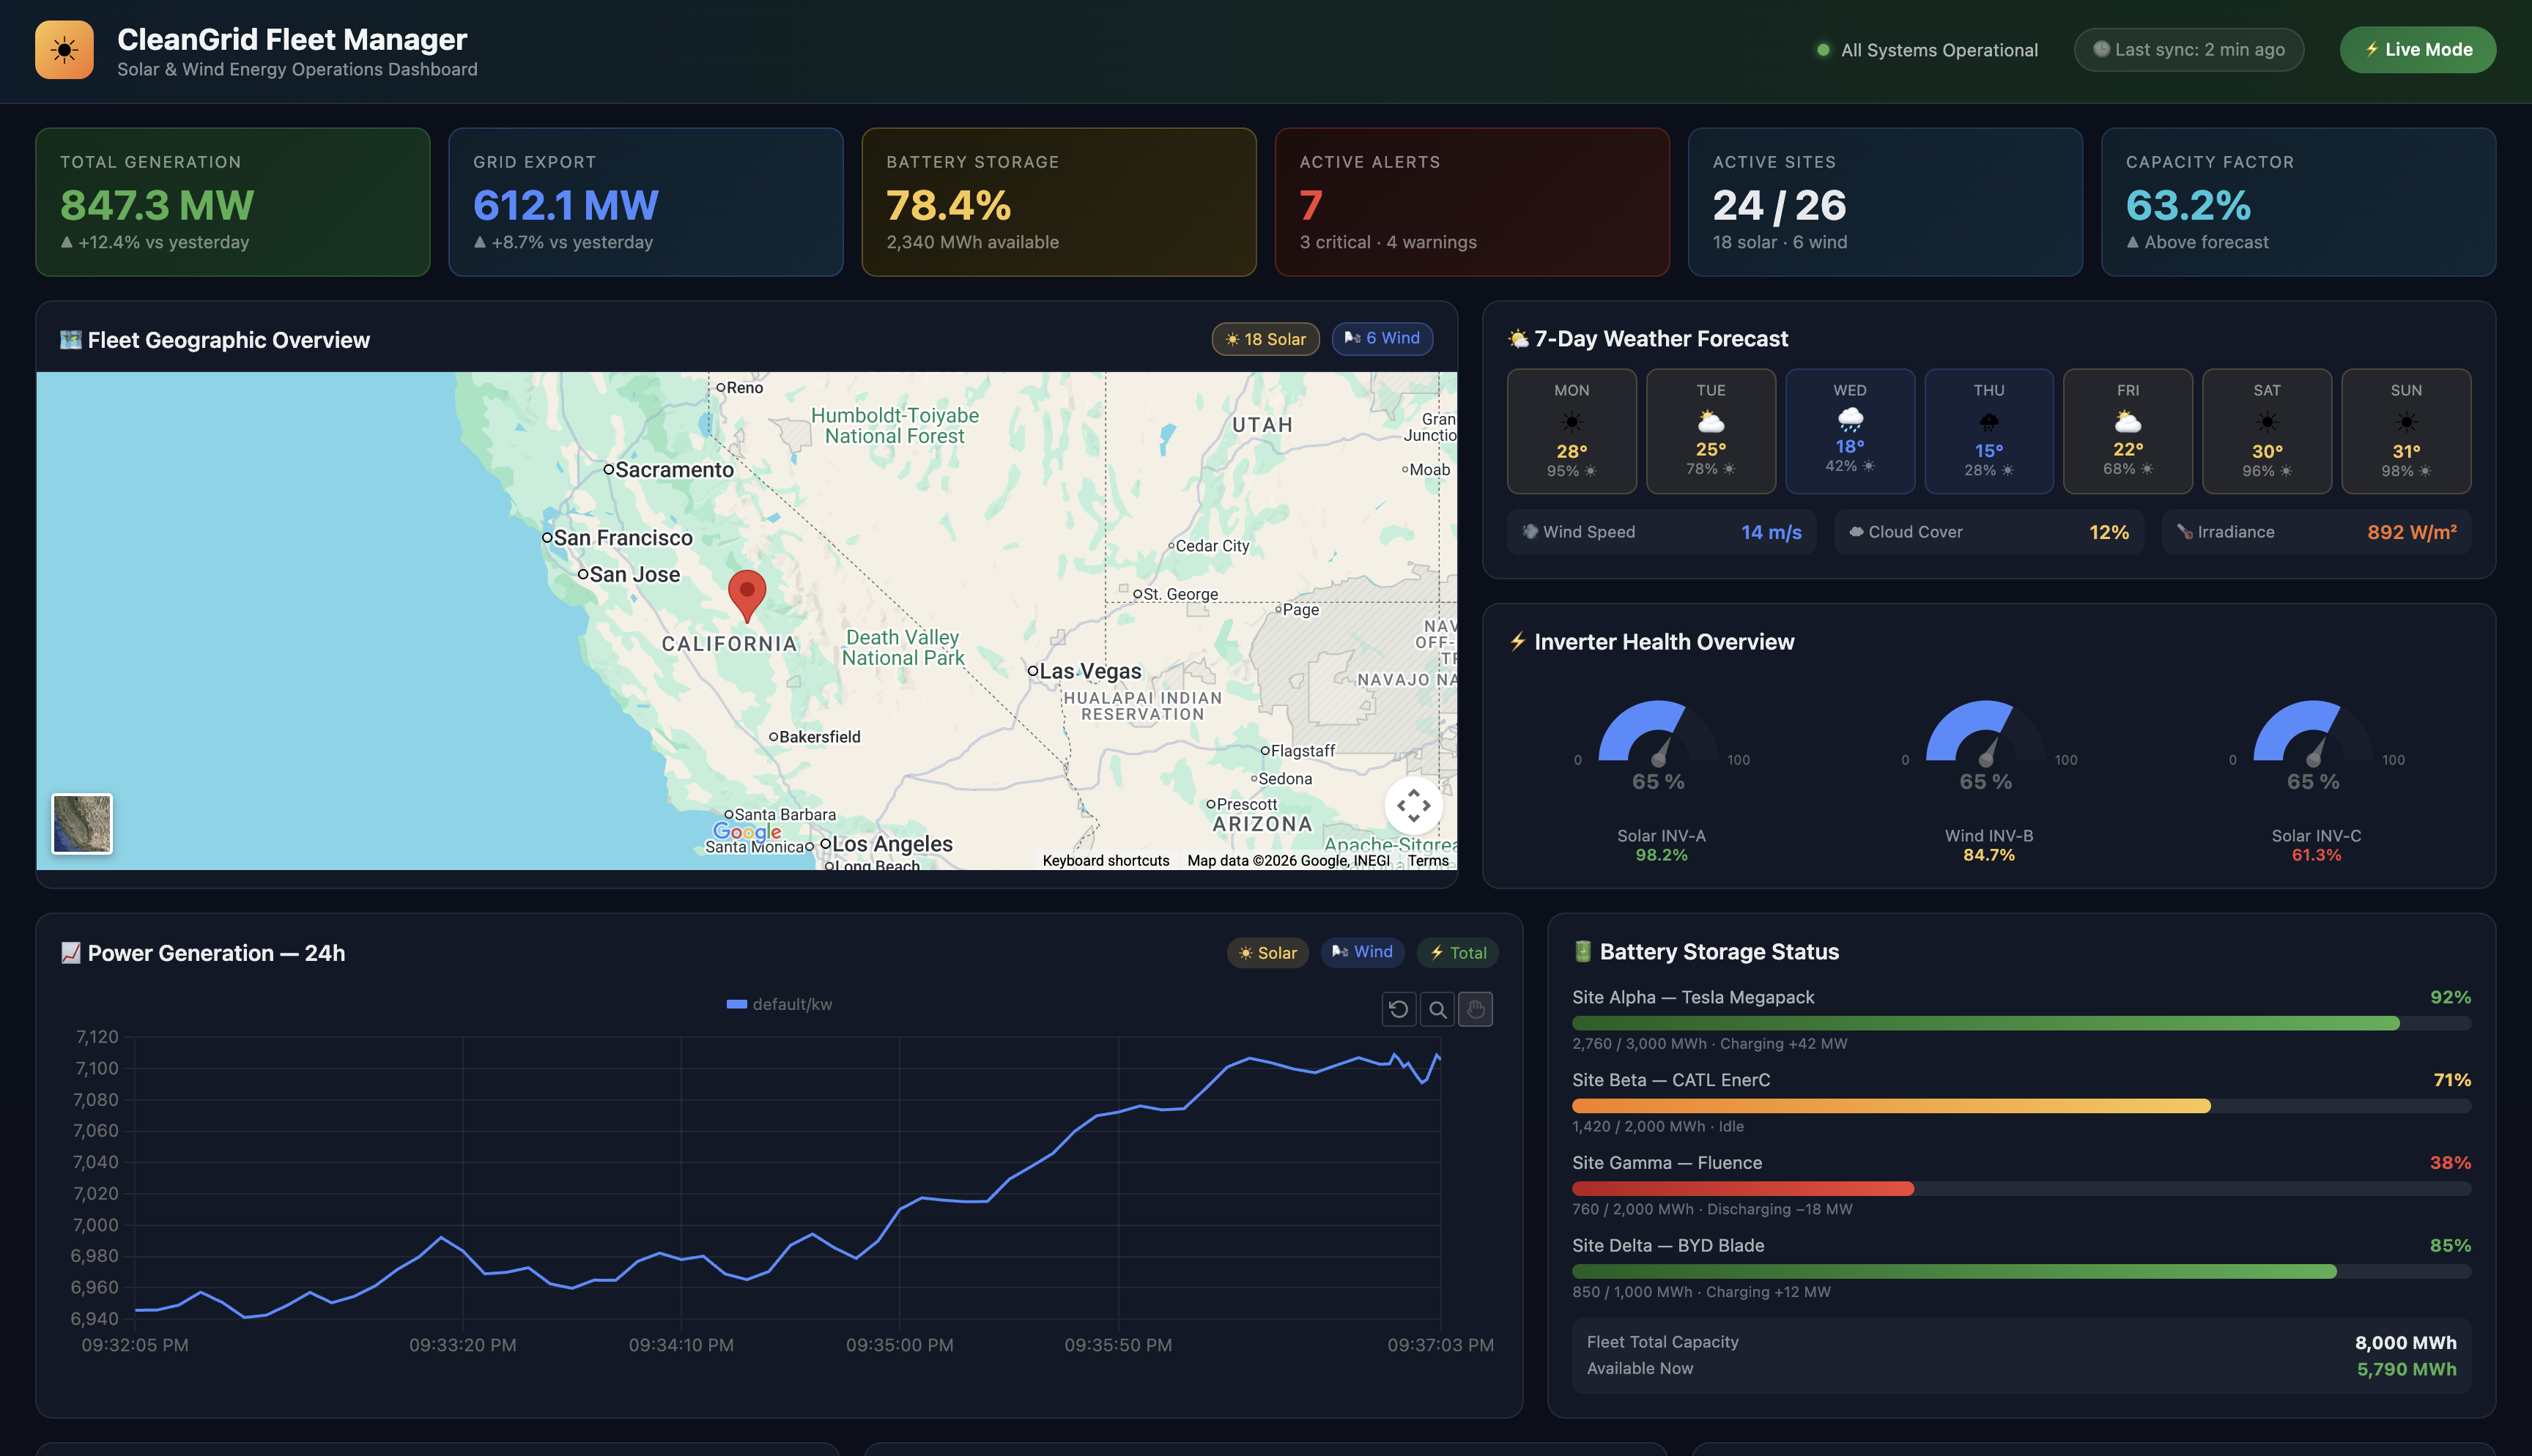
Renewable Energy Fleet
Create a dashboard for managing a fleet of solar farms and wind turbines. Show weather forecasts, power generation, inverter health, battery storage levels, grid export statistics, and maintenance alerts. Use modern clean-energy visuals and interactive geographic layouts.