Rotating equipment
Motors, pumps, fans, compressors, and gearboxes.
Investigate bearing wear, imbalance, misalignment, gear mesh issues, and cavitation. Use vibration and ultrasound, with speed, load, and temperature data when available.
FactoryOS Predictive Intelligence uses AI to spot warning signs before equipment fails. Ask questions about your equipment, investigate changes, and review the measurements behind each finding. Monitor rotating equipment, process systems, and electrical assets with wireless sensors, existing plant data, or both. PLC, SCADA, and historian connections are optional.
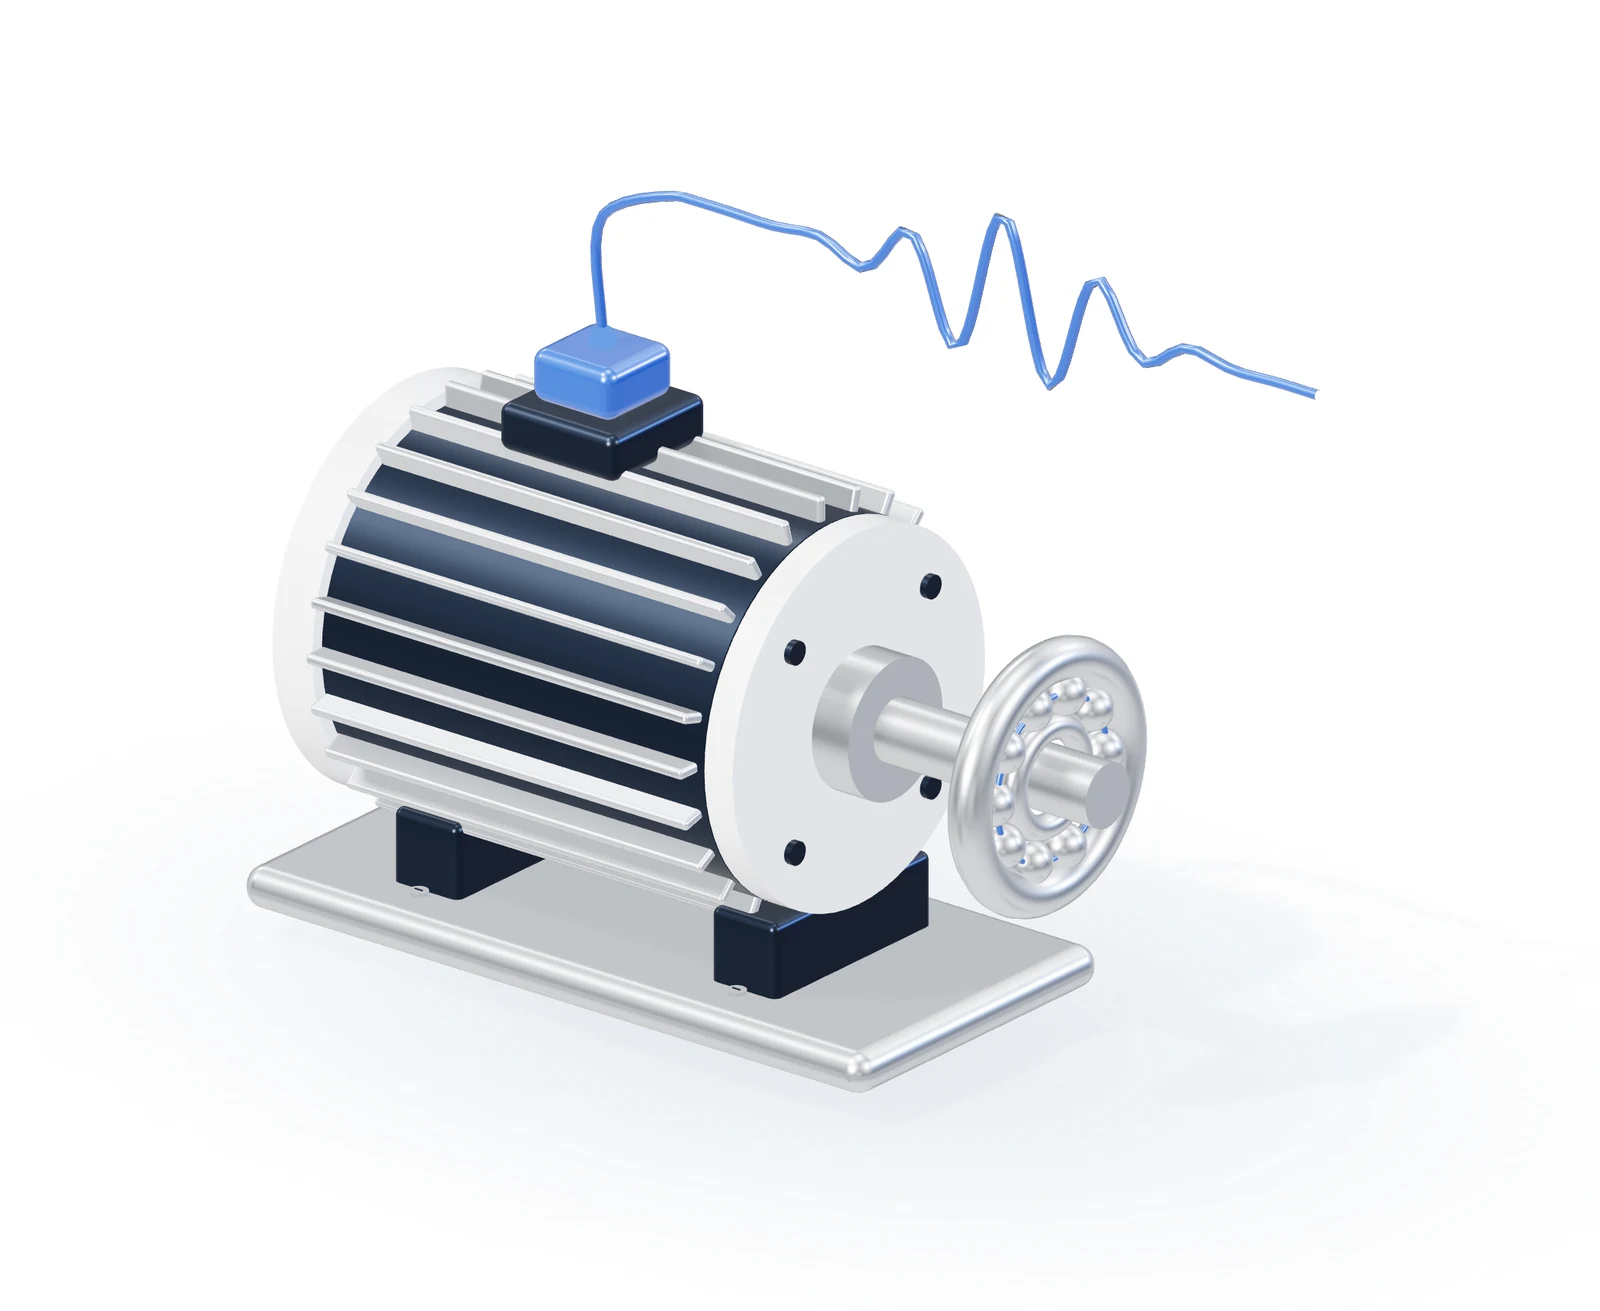
A wireless sensor monitors motor vibration.
Monitor with sensors, existing plant data, or both. Choose the measurements that suit each asset and compare changes with its normal operating behavior.
Motors, pumps, fans, compressors, and gearboxes.
Investigate bearing wear, imbalance, misalignment, gear mesh issues, and cavitation. Use vibration and ultrasound, with speed, load, and temperature data when available.
Valves, filters, heat exchangers, and pumping systems.
Follow pressure, flow, temperature, and valve timing to identify performance drift, filter loading, fouling, and leaks.
Panels, transformers, and electrically driven equipment.
Track power factor, phase balance, current, and temperature to investigate electrical changes and unusual heating under different operating loads.
Build monitoring around your own equipment using sensors, existing data, or both. Establish normal operating behavior and investigate changes in performance, efficiency, or cycle time. Review the measurements behind each finding.
Use wireless sensors on their own, connect data from existing systems, or combine both. Choose what works for your equipment and your team.
Establish how your equipment normally runs. Compare changes with historical measurements and any available operating data to distinguish a process change from a developing issue.
Ask what changed, compare signals, and explore possible causes with AI that can read your equipment data. Review the evidence before deciding what to inspect.
Wireless vibration, ultrasound, and temperature sensors send readings through a gateway to FactoryOS. Monitor with sensors alone, without connecting a PLC, SCADA, or historian.
You can also use pressure, flow, current, and other readings from existing systems. Use either approach on its own, or bring both together to investigate equipment health and operating conditions in one place.
Read the machine health guide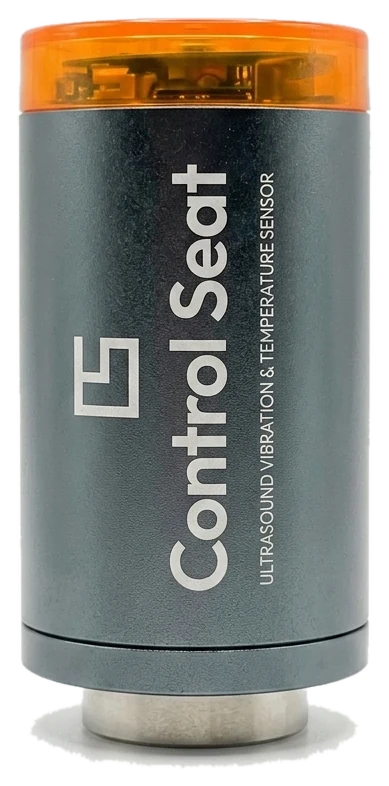
Use Predictive Intelligence on its own, or connect it with the other FactoryOS modules. They share equipment data and history, so your team can work from the same information.