The SCADA platform
for modern operations

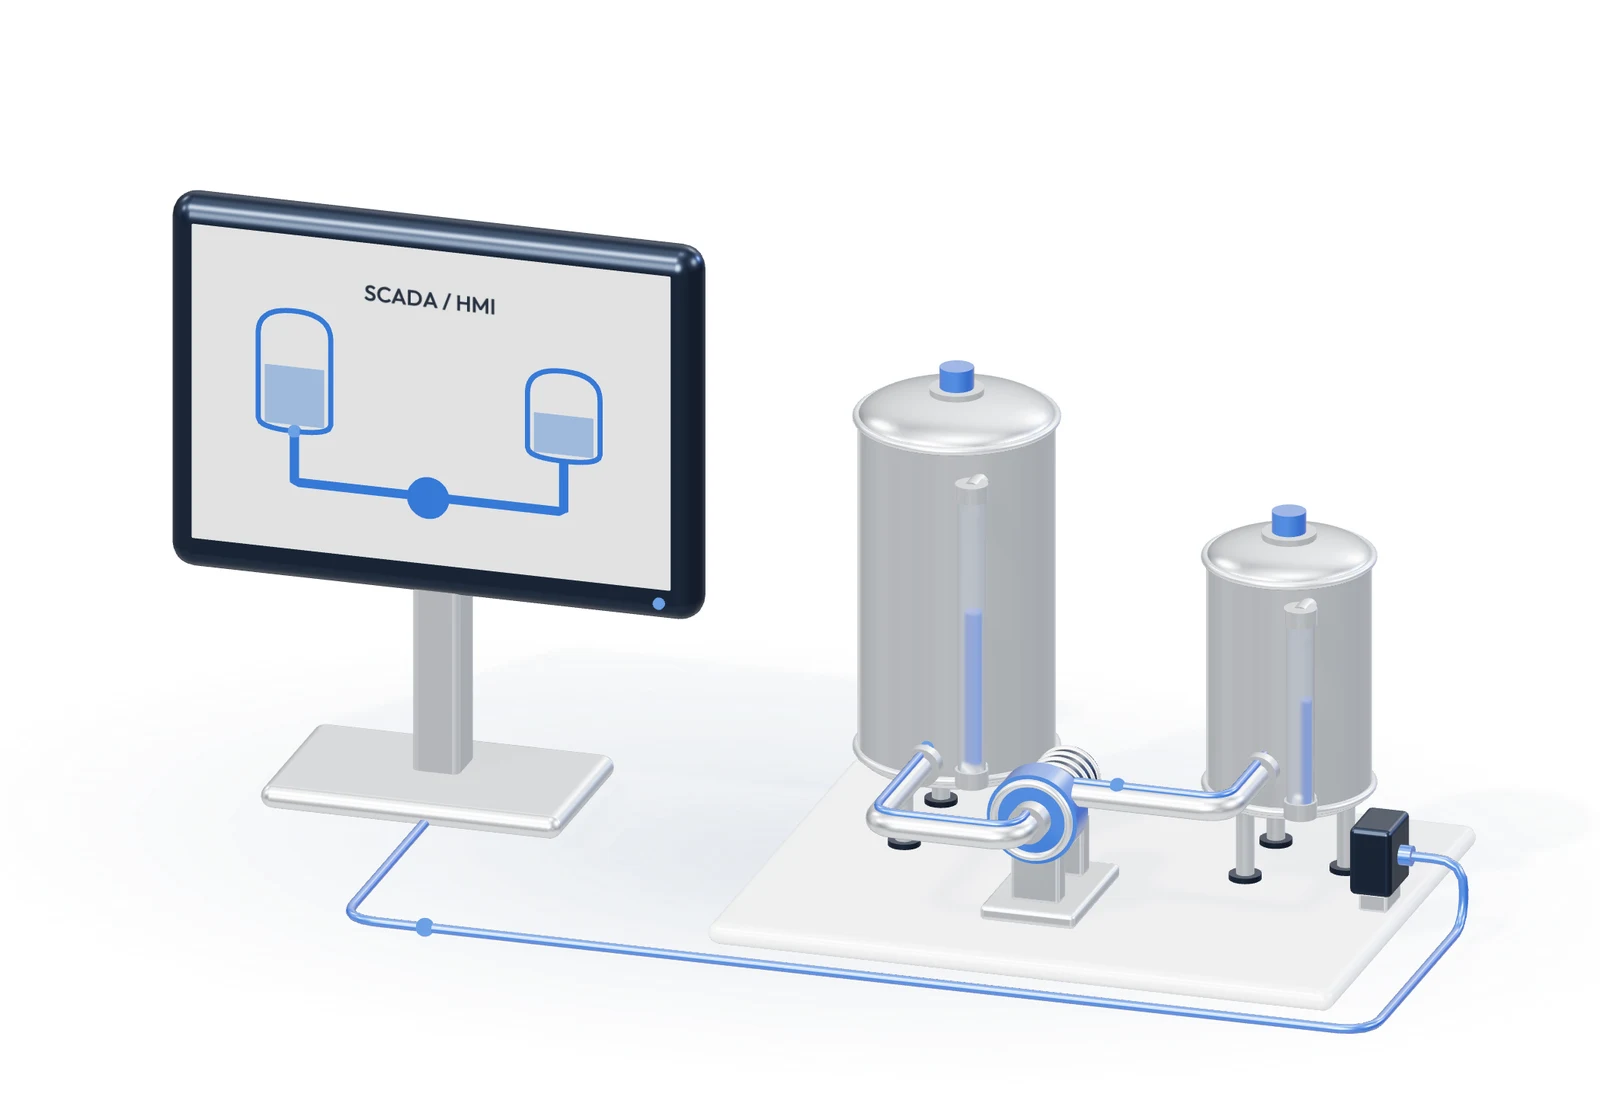
Control Seat SCADA is the software we build on. It connects to the industrial data you already have, across SCADA, historians, databases, and APIs, then lets you trend, analyze, forecast, and ask questions about your operations. Deploy it standalone or as part of a full integration.

One layer over all your industrial data.

Bring SCADA, historians, databases, and APIs into a single live data layer. Every trend, analysis, and automation reads from the same place and stays in sync automatically.

  • Industrial connectivity: OPC UA, MQTT (Sparkplug B), AVEVA PI, and Ignition.
  • Databases and APIs: PostgreSQL, MySQL, InfluxDB, Prometheus, and REST, plus anything else you need on request.
  • Real-time and historical: stream thousands of tags sub-second, with history from the built-in historian or queried straight from your existing systems.
SCADAAVEVA PIIgnitionSQLREST APIControl Seat

Investigate any signal in a live trend workbench.

Plot any signals together on synced charts, scrub through history, and mark the moments that matter. Save investigations as your own worksheets and write up findings in a built-in journal.

  • Synced multi-signal charts: stack or overlay signals, with shared zoom, pan, and cursor.
  • Conditions and capsules: highlight the time windows where something is true, right on the chart.
  • Worksheets and journal: save investigations, annotate them, and pick up where you left off.
Line 1Line 272.4

Detect, forecast, and explain what your data is doing.

More than twenty analysis tools run directly on your historical data. Find anomalies and step changes, forecast where a signal is headed, run frequency analysis, and compare patterns, with no separate data-science stack.

  • Anomaly and change-point detection: surface unusual readings and step changes automatically.
  • Forecasting: see where a signal is heading, with confidence bands and models like AutoARIMA.
  • Deep analysis: run frequency analysis (FFT), regression, histograms, and pattern matching on any signal.
nowanomaly

Ask questions. Get answers.

Ask about your operations in plain language. Control Seat's AI uses the same analytics tools to find anomalies, correlate signals, and write up what changed, then can build the view to show it.

  • Faster root cause: surface correlated tags and anomalies in seconds instead of hours.
  • Plain-language analysis: reason over years of process data without writing a query.
  • From answer to view: turn a question into a chart or dashboard in one step.
Why did Line 2 throughput drop overnight?AI ANALYSIS−18% flowRoot cause: cooling pump 3 stalled
Latency< 100ms
Tags10k+/sec
Uptime99.9%

Build, customize, and automate on top.

Analytics is the core, but Control Seat is a full platform. Turn what you find into dashboards and automation that runs around the clock, with custom code when you need it.

Dashboards

Build dashboards with a drag-and-drop editor, or let AI generate them from a description.

Custom code

Drop down to HTML, CSS, and JavaScript for bespoke views over your live data.

Flows

Gateway logic for alarms, schedules, and triggered automation that runs 24/7.

Enterprise features for
fast, scalable operations

Dedicated supportOn-premiseSSO & SCIM
Role-based accessAudit logsCustom integrationsSLA guaranteeWhite labelingPriority support
Ready for scale?Book a demo

See it on your own data.

Tell us about your systems, your data, and where you're stuck. We'll show you what Control Seat SCADA can do on top of what you already have.

Get a demo